


Well friends, it seems we are no longer lost lambs floating in a dark soulless expanse. Thanks to an international team of researchers, we now know exactly where we are in this cold indifferent universe — all we need to do is look at the largest and most detailed 3D map ever created of the universe.
Go on, look! It’s all dots to me but what do I know? Maybe if you zoom in you can see your house.
Obviously I’m joking. There’s no way you own a house in this economy.
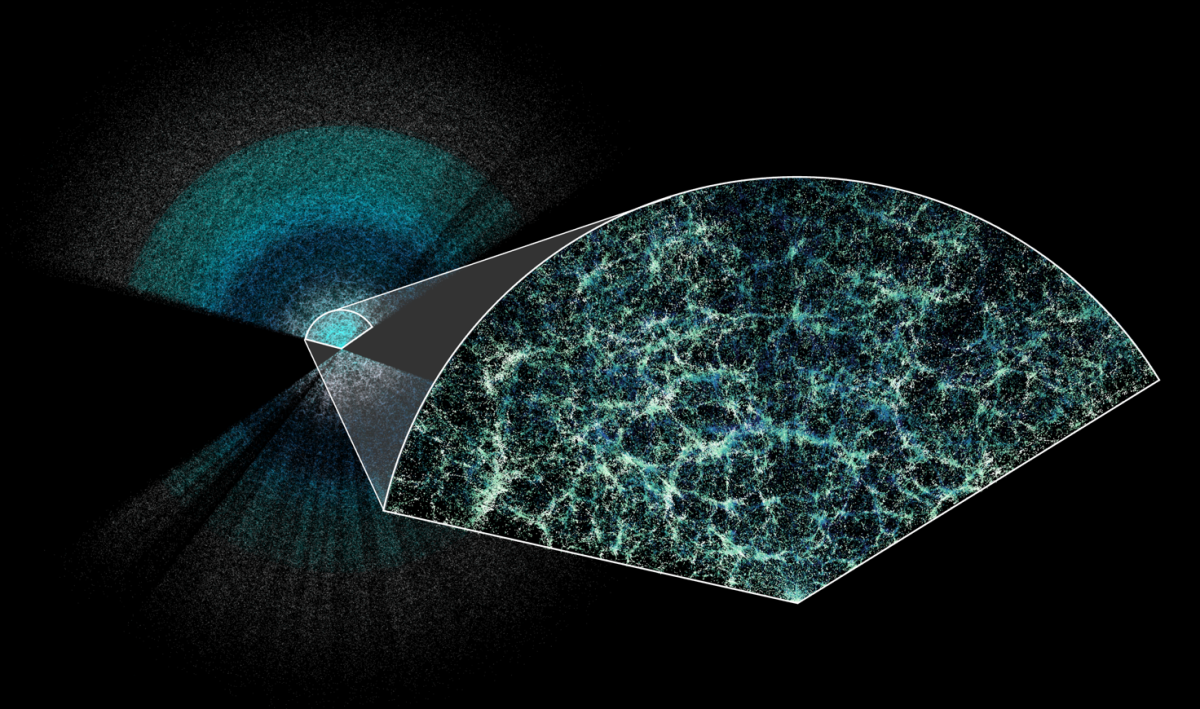
Still, if you are wondering where our home planet sits in this grand spectacle of teal and turquoise, it’s actually right in the centre of that zoomed-in slice of the full map.
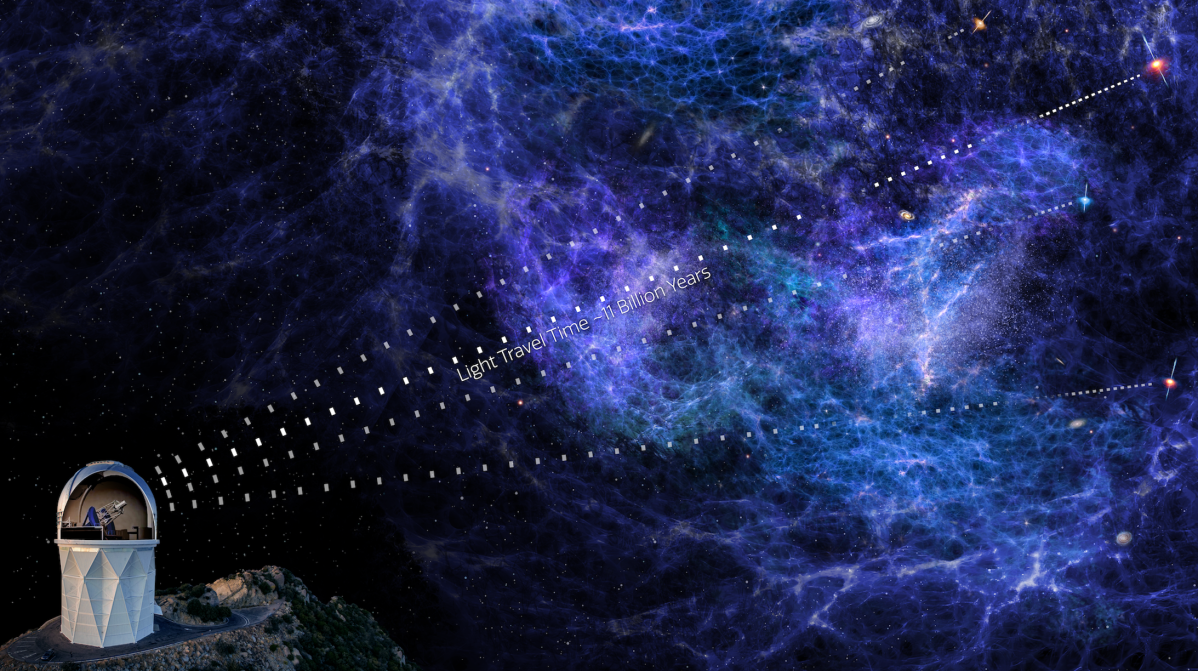
This map is cool for myriad reasons, one being it literally measures the expansion of the cosmos over the past 11 billion years. Wild.
University of Queensland’s Dr Cullan Howlett helped develop the software used for analysing data collected as part of the Dark Energy Spectroscopic Instrument (DESI) survey, according to a press release from the university.
DESI is being used to gain insight into the mysterious nature of dark energy — the force behind the universe’s expansion.
This data from DESI was then used to make “the most precise measurements to date of how fast the universe has expanded throughout history”.
“The team at UQ was responsible for developing one of the key pieces of software used for analysing the survey data, which helps search for a very specific feature in the map,” Dr Howlett said.
“The software models the size and shape of the Baryon Acoustic Oscillation (BAO) feature, a remnant of sound waves from the early universe.
“The BAO’s size acts as a standard ruler, and by comparing its size at different distances from Earth to how big it should have been in the early universe, we can measure the expansion rate of the universe.
“This information allows us to peer 11 billion years into the past and study how the universe has evolved over time and measure the effects of matter and dark energy.”
The 3D map is made up of the longitudinal and latitudinal coordinates of millions of galaxies. It allows researchers to measure each galaxy’s distinct light “fingerprint” by observing its chemical makeup, “observed by measuring the presence of chemical elements like hydrogen, oxygen, and nitrogen”, according to the release.
“We decoded that fingerprint, identified the individual elements, and compared the measured frequencies to those in a lab on Earth to get the distance from us,” Dr Howlett said.
“Once we had millions of sky positions and distances, we put each galaxy at its location relative to Earth and built a literal 3D map to analyse.”
Swinburne University of Technology’s Dr Ryan Turner helped develop statistical tools for measuring the movement of galaxies, and developed software that can analyse that information in order to further our understanding of the gravitational laws that govern our universe, as well as the rate at which different galaxies form.
“This is like going from a hand-drawn map of the universe to a satellite image,” Dr Turner said.
“With our much more detailed map, we can picture a larger area and now have significantly more detail in those farther away places and a much more detailed understanding of the structure in our patch of the universe.
“DESI’s new data greatly surpasses all previous surveys of its kind, and with better maps comes better understanding of some of the universe’s most enduring questions.”
This map essentially brings us a step closer to understanding what the hell is going on.
“As the 3D map evolves with more data, we anticipate our understanding of cosmic structures, dark energy, and the fundamental laws governing our universe will continue to refine,” he said.
“But for now, we’ll continue to explore this map in search of more universal dark secrets.”
The DESI data is available for anyone to look at. You can see it all here.
Main image: Futurama