NFT transactions: As we reported earlier this week, the NFT space has captured a wave of optimism in recent weeks, with investors and artists allied in their hopeful expectations for the imminent return of a bullish market, all-time highs and a jpeg renaissance.
But let’s go deeper than human sentiment and Twitter convictions to the hard, cold mathematical statistics of the blockchain. What do they expose about the current state of the market? And is 2023 shaping up to be one to remember for NFTs?
NFT transactions: Macro environment
In conversation with The Chainsaw, Nansen data journalist Martin Lee discussed the prospect of an NFT bull market, analysed the early market trends emerging from the opening week of 2023, as well as identified key metrics to ensure investors stay ahead of the curve.
Lee revealed that the NFT market is currently following a similar cyclical pattern to that of the past few years. “Whenever there’s price stability in the broader crypto markets, NFTs typically start seeing upward trends in their prices”, he explained, stating that once “confidence flows back into the market, NFTs respond positively.”
Remarking on the possibility of an NFT bull cycle within 2023, Lee stated that macroeconomic conditions – such as the stock market and global events including Covid-19 and the Russia-Ukraine war – will “heavily impact the amount of liquidity in crypto and the world at large”, before adding:
“With the cost of capital being much higher than it was the previous years, funds and institutions will be more cautious.”
Martin Lee
NFT transactions: Index
An index chart from Nansen Pro shared with The Chainsaw titled ‘Smart Money: Stablecoins vs All Coins’ showcases the percentage level of “top performing wallets” holding stablecoins assets versus other crypto coins. Stablecoins are currently being held at a rate of 29%.
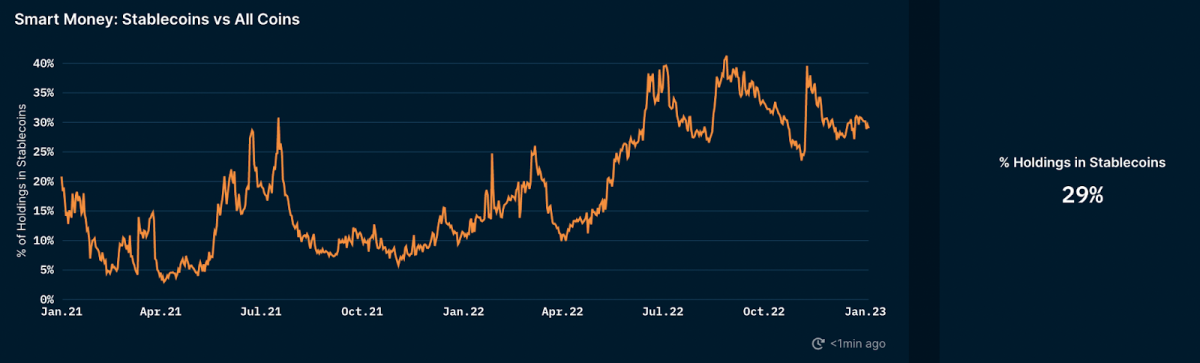
Investors should be focused on identifying a “drop in smart money stablecoin holdings and a shift towards riskier assets”, claimed Lee, with that being one of the most accurate on-chain metrics in the early detection of significant market moves.
Lee’s insights indicate that a decrease in stablecoin holdings (the above chart) has the potential to be the catalyst for an forthcoming rise in prices. “Stablecoin inflow to exchanges, or a growth in their market capitalisations, are both signals of capital flowing into the space”, he stated.
When on-chain volume increases, it means that assets are being transferred from external sources such as digital ledgers onto centralised marketplaces such as Binance, Coinbase and Kraken, injecting more capital to be spent in the ecosystem.
This could be anything from tokens to shitcoins to new NFT mints – whatever floats your boat.
NFT Analysis
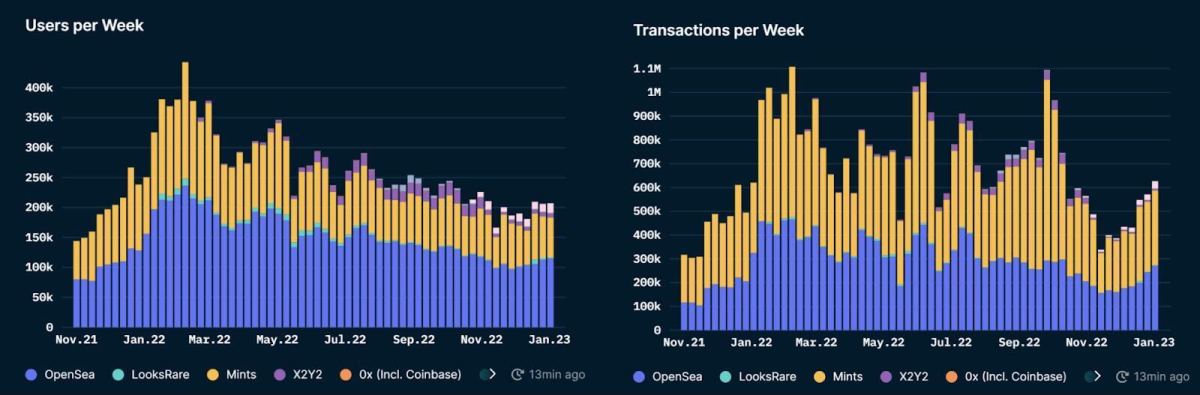
On the NFT front, the transactions per week chart prints a third-consecutive week of strong upwards trend, smashing through the psychological 600,000 figure in the first week of January to land near the 625,000 mark.
Although the chart saw a hard rebound from yearly-lows of 350,000 in November, it still remains some way off all-time highs of 1.1 million witnessed in February last year during the latter stages of the NFT bull market.
As for users per week, the story is one of consolidation, if not gradual decline. The chart is following an almost perfect declining trendline from the summer of 2022, tepidly pursuing new growth, but rather sustaining its core user base.